Timing Analysis of Paths Part - I
Today, we are going to
see the computation of delay of a path. Also, we will discuss some question arises
during the computation. Here, we go………………
We are going to perform the analysis of a path e.g. Reg-to-Reg path. We are discussing the setup and hold analysis of the given timing path. Also, we answer the question of -
- why we used max and min delay of the cell?
- why we considered the Min delay and Max delay table for hold and setup analysis respectively?
- why we are not considered the worst case and best case in the same analysis?
As we have seen in the previous
post, the delay of a cell is depending on input slew (transition) and output load.
Here, we are discussing delay calculation of path by just directly providing
min and max delay. In the actual project, these delay table provided in a standard
format called Liberty by the process of Characterisation. The Liberty
file is providing by library vendor (it can be Fab also).
We will discuss the Characterisation
and Liberty file under the heading of Design setup.
For the analysis, consider
the following values,
Min Combo logic delay:
0.2ns Max Combo logic delay: 0.7ns
Min Clk-to-Q delay: 0.4ns Max Clk-to-Q delay: 0.7ns
Setup time of FF: 0.3ns
Hold time of FF: 0.3 ns
Time period: 2ns
 |
| Figure: Reg-to-Reg Path |
While performing setup
and hold analysis we have used Min delay table for Hold analysis and Max delay
table for Setup analysis.
Why So??
A chip must work in all
possible conditions whether is a normal case, best case or even in the worst case.
While analysing a timing path, we always perform the analysis in the worst
case. Because if design meets its all timing constraints in the worst case,
then it will work in any condition or any case.
Now, while performing
the setup analysis, we check whether data is stable or not during setup
time. It means that data must be calculated or processed before reached to
setup time phase. Here if the Flip Flop does not have enough time to process
the data the flip flop reached into metastability state. This is only happening when data is slow and
it causes setup violation. This case occurred when at worst PVT corner.
Means slow process, low voltage and high temperature. That’s why while performing
setup analysis, we used Max Delay Tables.
Similarly, while performing
the hold analysis, we check whether data is able to capture by flip flop
or not. While doing so, data must not be changed for hold time interval i.e. data
must be stable. If data change during a hold time interval, the flip flop reached
into metastability state and caused hold violation. This is only happening when
data is faster. This case occurred when at best PVT corner. Means fast
process, high voltage and low temperature. That’s why while performing hold
analysis, we used Min Delay Tables.
In short, slower
the data caused setup analysis and faster the data caused hold violation.
If we see as per the formula
of setup and hold analysis, then the picture is different. To consider the
worst-case:
In Setup Analysis:
For AT, we can use Max Delay Table; For RT, we can use Min Delay Table.
In Hold Analysis:
For AT, we can use Min Delay Table; For RT, we can use Max Delay Table.
But we can not use two
different PVT corner at the same analysis. Also, it is not efficient. That’s
why we have to consider only max delay table for setup analysis and only min
delay table for hold analysis.
REG-TO-REG PATH ANALYSIS
Now, we can move towards
timing analysis of Reg-to-Reg path. Considers the values and refers to the
above diagram for the analysis.
The analysis consists of
Arrival Time (AT), Required Time (RT), Setup Time and Hold Time. What are AT and RT? For it, refer
the previous post of TERMINOLOGIES OF STA.
Setup Analysis
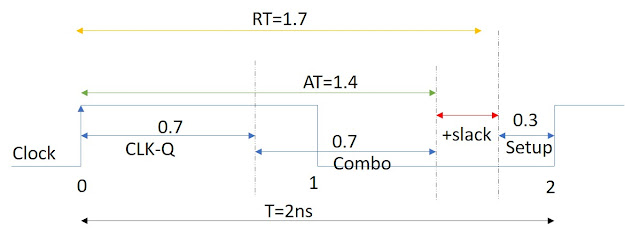
AT = (Clk-to-Q delay)MAX
+ (Combo delay)MAX
AT = 0.7 + 0.7
AT = 1.4 ns
RT = Time period - Setup time of FF
RT = 2 – 0.3
RT = 1.7 ns
Setup Analysis = RT – AT = 1.7 – 1.4 = 0.3ns (MET)
 |
| Figure: Setup Analysis |
Hold Analysis
AT = (Clk-to-Q delay)MIN
+ (Combo delay)MIN
AT = 0.4 + 0.2
AT = 0.6 ns
RT = Hold time of FF
RT = 0.3ns
Hold Analysis = AT – RT =
0.6 – 0.3 = 0.3ns (MET)
 |
| Figure: Hold Analysis |
Here, the values of delay
are random and path also met. But in actual analysis, it varies.
There are some other
paths which we have to analyses such as reg-to-out and in-to-reg. In these
paths, the component like input external delay and output external delay
is added. We will see such path analysis in post.
At this note of
discussion, we stopped here and we will continue this topic in the TimingAnalysis of Paths Part - II. Thank You. Have a nice day.


Comments
Post a Comment
If you any doubt, please let me know